
Benchmarking the cost of repairs and maintenance 2015
These Performance Indicators are designed to capture the total spend by the landlord and show how it breaks down into categories. The exercise generated some useful discussions last year and we are repeating it for 2015. The addition of year-on-year data should help us to identify where SPBM members are making savings over time.
We are using the following categories of weekly spending per property
- Reactive / Responsive repairs
- Cyclical maintenance
- Major works
- Overheads
- Fees
- Void works
- ‘Other’
To take part
Click here to download the spreadsheet and definitions and return it by 30 May 2015 >>
Results from last year
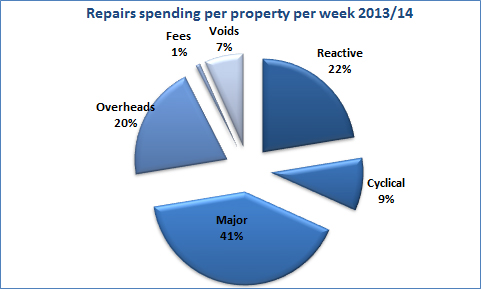
On average SPBM members spent £36.07 per property on repairs in 2013/14, or 40% of their rent roll. This was broken down as follows:


Comments are closed.