
A question which has crept in to customer satisfaction surveys over the last few years is the Net Promoter Score (NPS). It still draws blank expressions, so here’s a quick canter through.
The question is simple enough “How likely would you be to recommend [your social housing provider] to family or friends on a scale of 0 to 10, where 0 is not at all likely and 10 is extremely likely?”
The analysis is based on the fundamental perspective that every organisation’s customers can be divided into three categories:
- Promoters (score 9-10) are loyal enthusiasts who will promote and support the landlord, increasing their reputation.
- Passives (score 7-8) are satisfied but unenthusiastic tenants who can easily become detractors depending on circumstances.
- Detractors (score 0-6) are unhappy customers who can damage your organisation and hold back development and growth through negative word-of-mouth.
The NPS is calculated by taking the percentage of customers who are Promoters and subtracting the Detractors. This provides a score not a percentage.
The NPS needs to be put into context. In the commercial sector, where the question originated, it is generally held that companies with the most impressive growth rates operate with an NPS of 50 to 80. Average companies tend to score 5 to10 – their Promoters barely outnumber their Detractors. This means, of course, that many companies, have a negative NPS – more people could do you damage than help you thrive!
What’s this got to do with us?
It’s easy to be sceptical about this (I was) given the completely different operating environments between the commercial and social housing sectors. The main issues:
- is the question valid in a closed market where residents have little or no choice to change providers?
- why would you recommend social housing to your nearest and dearest?
- what will the information tell me about my residents?
However, research to date confirms the link between NPS and overall satisfaction – it is a good proxy. But clearly, just having a different way to get to the same place isn’t enough.
NPS provides us with an alternative route into analysis and understanding – the starting point for improvement. When you examine results in detail, look at your Promoters. These are the people that when they get talking about their landlord are likely to be enthusiastic about their home and the service they get. Given the bad press the sector is getting at the moment we could do with these people fighting our corner! Now look closer: what is it about your homes and services that creates such happy customers – what is working well? Great for promoting good work and exploring how success can be exported to poorer areas.
Look at your Detractors: focus on those at the bottom end. Who are they? Where do they live? No, don’t reach for the baseball bat; are there patterns or traits that will help you categorise them? Now look at the problem: what are your respondents dissatisfied with? Everything or something specific? If you talked to this group in the street, it’s likely they would be negative and even influence other people’s perceptions because people talk more about poor service than good. Based on your understanding of the people and the problems, what can you do to turn this around?
The Passives will be easier to influence and impress than the Detractors. As a group, how are they different to the detractors? To what extent does their dissatisfaction overlap with the problems identified by the Detractors? This will help you narrow the focus on what needs to be done.
Finally, many social landlords increasingly want to compare against the best in the commercial sector. NPS makes this possible.
What’s the score?
HouseMark is due to update its NPS tables for 2014/15 along with 2015/16 in the autumn. We’ll revisit this topic then to see what progress the sector has made.
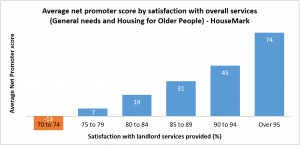
Meanwhile, Acuity has undertaken its own analysis of satisfaction and NPS data (2014/15 onwards) from nearly 100 landlords. It suggests that the highest performing landlords should be looking to achieve NPS in the order of 45.
We face a future where we need to maintain satisfaction as it’s an important part of the mission, but possibly with reduced resources. NPS offers a different route into understanding and meeting customer expectations that also makes comparisons with the commercial sector possible. It’s worth considering when you next undertake a satisfaction survey.
As always, we’d be happy to discuss your approach to this and surveys in general.


Comments are closed.