
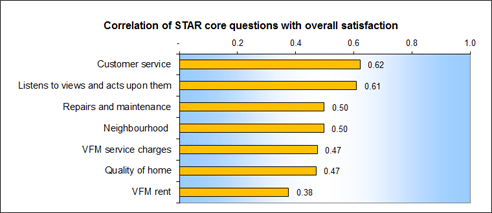
When carrying out our analysis of survey findings we look at the correlations between overall satisfaction and other satisfaction measures. Correlations (sometimes also referred to as key-driver analysis) quantify the degree to which two variables are associated and it is generally accepted that a coefficient of 0.4 or more suggests a strong association.
Correlation is commonly used in customer satisfaction research to carry out key-driver analysis. The higher the correlation, the stronger the relationship between the responses to two questions. Correlation should be treated with some caution, however, because it does not demonstrate that one factor is the cause of another.
The correlation coefficient is calculated using a standard statistical formula to quantify the degree to which two variables (the ratings) are associated, and will always be a value between -1 and +1.
A large positive correlation means that two ratings “move together” — when one goes up, the other tends to go up. Negative correlation means the ratings move in opposite directions — when one goes up, the other goes down.
A correlation of 1 means there is an exact linear relationship between two ratings. In other words, if every single tenant has given the same rating for ‘overall satisfaction’ as for ‘repairs and maintenance’. Similarly, a correlation of -1 would mean the exact opposite relationship.
A correlation of 0 usually means the variables are not associated.