
The latest Tenant Satisfaction Measure results offer an opportunity to reflect on residents’ experiences and what they mean for services across the sector. At Acuity, we believe these results are about more than scores; they’re an opportunity to listen to tenants, understand what matters to them, and use that insight to improve services.
In this blog, Peter Stephenson, our Head of Research, looks beyond the headline figures to explore five key questions landlords should be asking about their results – from choosing relevant peer groups to understanding whether tenants can see that their voices are being heard and acted upon.
1. Place Matters: Is 74% Really 74% Everywhere?
The Regulators’ release just over a week ago showed overall satisfaction had a moderate increase to 74%. But 74% doesn’t mean the same everywhere. In October 2026, Acuity reported that there was a clear North/South divide in satisfaction, with those in the North West the most satisfied (81.1%) and London the lowest at 65.1%.
The recent release from the Regulator supports this:
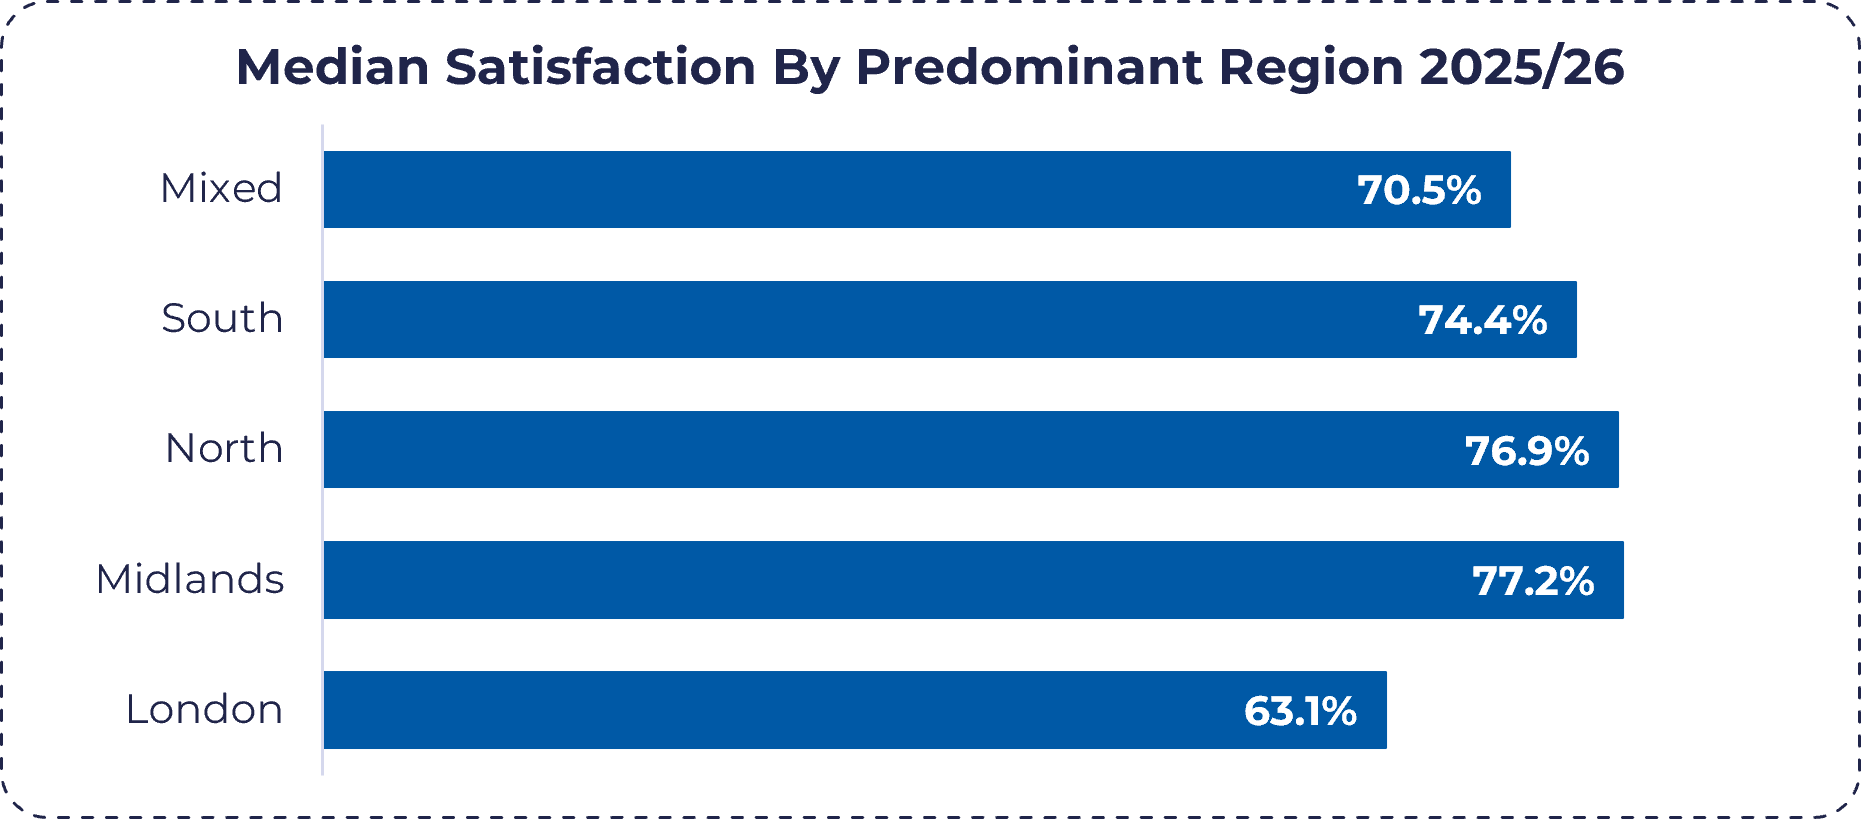
This matters when landlords benchmark their performance. A national median provides a useful reference point, but it shouldn’t be viewed in isolation. Geography, landlord type, stock size and other characteristics can all provide important context. A landlord performing above the national median may look very different when compared with similar landlords operating in the same region.
That’s why at Acuity we look at TSM data through more than one lens, comparing performance against the national median, stock size, provider type and region to help landlords understand how they are performing against relevant peer groups.
2. Tenant Voice: Can Tenants See the Difference Their Feedback Makes?
Respectful and helpful engagement scores have improved, but satisfaction that landlords listen to tenants’ views and act upon them remains comparatively low at 63.9%. The issue is therefore not whether landlords are collecting tenants’ views, but whether tenants can see that those views make a difference.
Communication is at the heart of all the TSM measures, whether that is repairs, neighbourhood contribution or listening and acting on views. How landlords communicate and manage expectations is crucial. It is not simply about collecting survey responses, but understanding who is responding, what they are saying and why, and then demonstrating to tenants that something has happened as a result. Regulation requires you to capture feedback – but as stated in the Sector Risk Profile – you need to use that data to drive and prioritise change. That is what makes people feel heard. Whether through emails, letters, posters, websites or approaches such as “You said, We did”, closing the feedback loop and showing tenants where their views have led to change can be extremely powerful.
With the Consumer Standards firmly established and Awaab’s Law Phase 2 taking effect from 30 November, the challenge is increasingly about understanding the individual behind the data: do you know who is behind the door, what matters to them and, crucially, are you acting when they tell you something is wrong?
3. Complaints: Are Better Processes Delivering Better Experiences?
Complaint volumes have increased considerably. The RSH Headline Report shows that Stage 1 complaints rose from more than 250,000 in 2023/24 to nearly 320,000 in 2025/26, while Stage 2 complaints almost doubled, from 43,000 to 82,000. The Regulator suggests this may reflect changes in how landlords define and record complaints, greater tenant awareness of the complaints process and, interestingly, the increasing use of online resources including AI to help tenants make complaints. [gov.uk]
At the same time, landlords are getting better at responding within the required timescales. Stage 1 compliance with Complaint Handling Code timescales has increased from 73.2% to 85.5%, while Stage 2 has risen from 66.9% to 82.3% since 2023/24. Yet satisfaction with complaint handling remains the lowest-scoring perception measure, at just 37.4%, only slightly higher than 35.5% last year. [gov.uk]
This raises an important question: are complaint processes improving faster than the experience of the tenants using them? Meeting timescales matters, but the results suggest that compliance alone does not guarantee a positive experience. For landlords, the next step is to look beyond whether a complaint was answered on time and understand the quality of the response, the outcome for the resident and, crucially, whether learning from complaints is actually leading to service improvement.
4. Methodology: Are You Capturing the Full Tenant Picture?
The RSH report breaks down TP01 overall satisfaction in several ways, with the collection method being one of the most interesting. Telephone remains the predominant method, and its use continues to grow, accounting for 65% of surveys in 2025/26 compared with 61% in 2023/24. While there have been smaller movements across other approaches, telephone remains the method of choice for most landlords.
There continues to be debate across the sector about the impact that the collection method can have on reported satisfaction, particularly given the higher scores associated with face-to-face surveys. However, face-to-face interviewing is considerably more resource-intensive, which helps explain why relatively few landlords rely on it. The important point is that methodology can influence results, so understanding how a survey has been conducted matters when making comparisons between landlords.
Good methodology is about much more than choosing the collection method associated with the highest score. Sampling, representativeness, geography, stock and tenure profile all matter, as does when residents are contacted, both seasonally and at different times of the day and week. The aim should be to give every section of the tenant population a realistic opportunity to be heard and to ensure the results genuinely reflect the views of the people and communities a landlord serves. Therefore, knowing your tenants and having confidence that you’re selecting the right contact for the right tenants becomes more and more important – at Acuity, we’re seeing increased interest in profiling surveys that capture essential data to help landlords identify and fill gaps in what they know about their tenants, enabling engagement to be better tailored to who is actually behind the door.
5. The Shared-owner Problem: What is Different About the LCHO Experience?
Just under 34,000 shared owners responded to the TSM survey in 2025/26. While overall satisfaction has increased from 48% to 50%, there remains a substantial gap between the experiences reported by LCHO residents and LCRA tenants.
The different service model clearly matters, as do the expectations of shared owners who are paying service charges for the services they receive. But does the model explain the whole satisfaction gap? There is perhaps a more fundamental issue around communication, responsiveness and managing expectations. Satisfaction that landlords listen and act is just 40.6% among LCHO residents, while satisfaction with complaint handling falls to 21.4%, the lowest of the perception measures.
Whether the issue is a service charge query, estate management, communication about planned works or a complaint, the fundamentals remain much the same: set clear expectations, communicate proactively, make it easy for people to raise concerns and demonstrate that you have listened and acted. The shared ownership model may be different, but that makes understanding and managing the relationship with residents more important, not less, which is why we’re exploring the launch of a dedicated Shared Ownership club as part of our membership community for 2027 – if you’d like to register your interest, contact us here.
At Acuity, we want to help landlords turn that understanding into meaningful action. By bringing together relevant benchmarking, thoughtful survey design and a fuller picture of residents’ needs, we can help make the conversation about more than scores – keeping the focus on the people and communities behind them.
What are your TSM results telling you? If you’d like to explore what sits behind the scores and how to turn residents’ feedback into practical improvements, get in touch with the Acuity team to start the conversation.
